Publishers Adopt Matrix Model to Forecast Steam Game Sales
Serge Bulaev
Publishers are starting to use a matrix model that combines several factors, such as demo play, community activity, and influencer interest, to better predict first-week Steam game sales. This method may give a more accurate risk profile than just looking at wishlists, especially since big campaigns often gather wishlists from people who never buy. The model uses weights for different signals, which can be changed for different game types and audiences. It also has ways to handle unusual spikes or drops in the data. Experts suggest the main value of this approach is to give a clearer, data-based reason for spending on launches, even if predictions are not perfect.

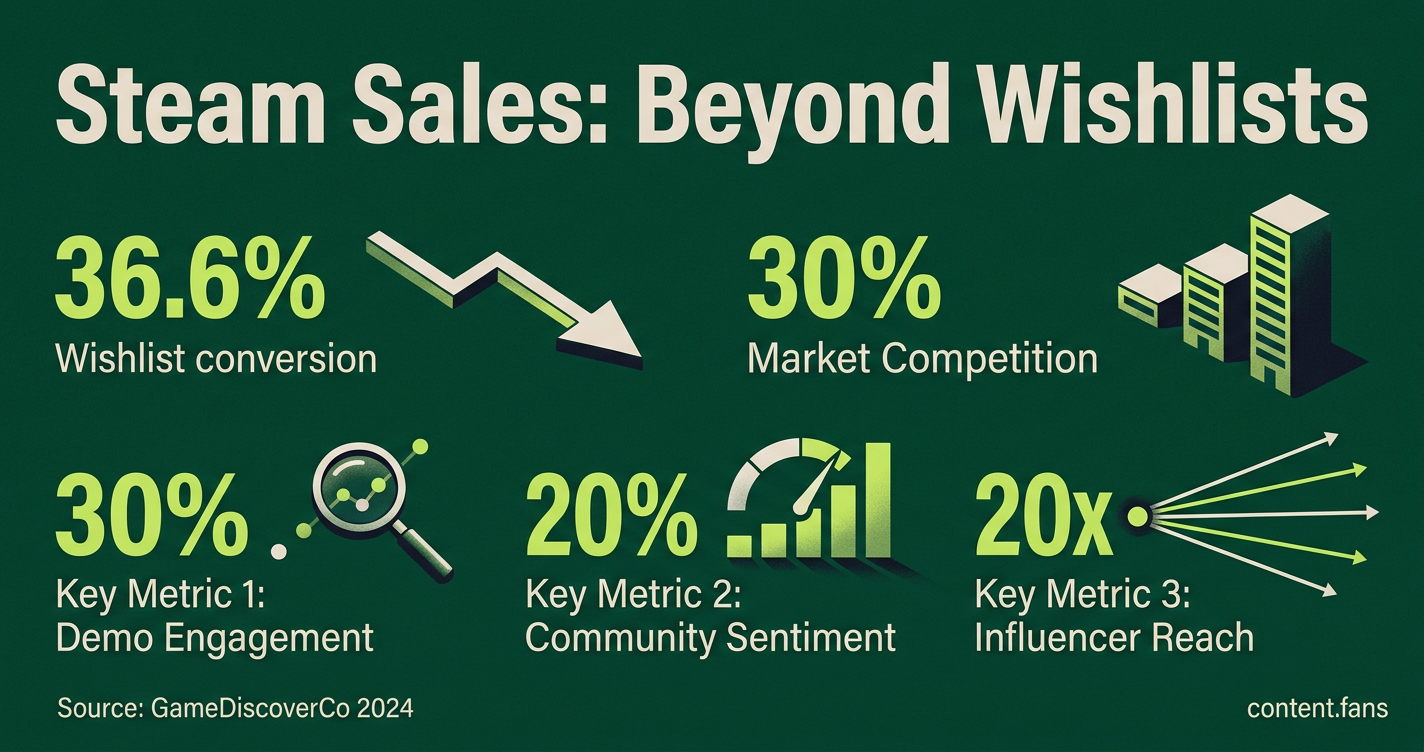
Publishers are adopting a multi-factor matrix model to forecast Steam game sales, moving beyond single-metric guesswork. This shift is driven by a competitive market with a growing number of annual releases and declining wishlist conversion rates, based on GameDiscoverCo's 2024 data (Revealed: the state of Steam wishlist conversions & "long tail" in 2024). This model provides a more nuanced risk profile by integrating weighted signals like demo engagement, community sentiment, and influencer reach for a probabilistic sales forecast.
Why Wishlist Totals Can Be Misleading
A sales forecasting matrix model combines diverse pre-launch metrics like demo engagement, community growth, and influencer attention. By weighting these signals, publishers create a more reliable, data-driven forecast of a game's first-week sales on Steam, providing a clearer risk profile than wishlists alone.
Relying solely on wishlists is problematic. Data from GameDiscoverCo shows that as wishlist counts grow, conversion rates often decline; games with larger wishlist counts tend to show lower conversion rates (GameDiscoverCo: The State of Steam Wishlist Conversions). This happens because large marketing campaigns attract many passive users who don't intend to purchase. A matrix model counteracts this by prioritizing active engagement signals, such as strong demo retention and vibrant community discussion.
Key Metrics for a Forecasting Matrix
A robust matrix model typically incorporates signals such as demo retention, Discord member growth, influencer coverage, follower-to-wishlist ratios, and wishlist momentum, with weights adjusted by genre and audience. Industry practitioners suggest that engagement metrics like demo retention and community growth often receive higher weighting than passive metrics, though the specific allocation varies significantly based on game type and target audience.
How to Handle Data Outliers and Anomalies
Forecasting models must account for unexpected events, like a viral stream boosting sales or a buggy demo hurting sentiment. Two strategies help manage these outliers:
- Capped Z-Scores: To control for extreme spikes, metrics exceeding a high threshold are capped before being rescaled. This method contains statistical noise without ignoring significant positive trends.
- Baseline Floor: Another technique, inspired by GameDiscoverCo's public estimators, uses the historical wishlist-to-sales ratio as a conservative baseline. Positive signals from other metrics can raise the forecast, but if the composite score is negative, the forecast defaults to conservative industry ranges to avoid overly pessimistic predictions.
Example Forecast: Mid-Core Tactics Game
Consider a hypothetical mid-core tactics game with strong pre-launch metrics across multiple categories: substantial wishlist totals, above-average demo retention compared to genre medians, growing Discord community engagement, organic influencer coverage, favorable follower-to-wishlist ratios, and positive wishlist momentum over time.
With these inputs, a weighted model might suggest an uplift over baseline expectations. A comprehensive forecast would include sensitivity analysis, showing how variations in key metrics could affect the projected range of first-week sales.
Commercial Applications of the Matrix Model
While high-variance results have made some, like GameDiscoverCo, cautious about offering a full SaaS tool, the model has clear commercial potential. It can be packaged as an advisory service that mirrors existing estimators (Estimating Steam/console sales: two hot methods!) or licensed to large publishers for internal use with regular updates and back-testing.
Ultimately, the model's primary value isn't flawless prediction but providing an objective, data-backed rationale for marketing spend in the critical pre-launch window. It replaces gut feelings with a calculated assessment of a game's potential by triangulating behavior, momentum, and community sentiment.
What is the matrix model for forecasting Steam sales?
Instead of relying on raw wishlist totals, the matrix model blends multiple pre-launch signals into a single score. Typical inputs are demo retention or Net Promoter Score, Discord traffic and sentiment, organic influencer reach, the follower-to-wishlist multiplier, and trending wishlist velocity. Publishers assign weights to each metric, genre-adjust the result, and obtain a probabilistic conversion estimate for the first week or month.
How is it different from classic wishlist-ratio forecasting?
The classic method multiplies launch wishlists by a fixed ratio based on industry observations (source). The matrix approach keeps that ratio as only one variable among many, reducing the impact of outliers and giving a confidence interval rather than a single-point forecast.
Which metrics best reduce outlier risk?
Engagement-first data dramatically improves accuracy. According to industry reports, many surprise hits that exceeded forecasts showed explosive Discord community growth, while fewer were flagged by high wishlists alone. Internally, studios often rank playtime, replay rate, and Day-7 retention as highly reliable behavioral indicators. Passive impressions such as YouTube views or store follows are far noisier.
Why have some analysts hesitated to run matrix-style models at scale?
Frequent commercial outliers can destroy credibility with investors or internal stakeholders. A single title that misses its band significantly can outweigh dozens of accurate calls, so consultancies often stick to simple, transparent ratios until larger data sets and stricter outlier trimming are in place.
Could this be sold as a service?
Yes. The same data pipeline can be offered as:
- An advisory report (one-off forecast plus sensitivity tables)
- A SaaS dashboard that updates whenever Steam, Discord or Twitch metrics change
- A portfolio risk model for funds that back dozens of games a year and need central tendency plus tail-risk estimates
The core requirement is clean, normalized inputs; without reliable demo telemetry or community logs, the matrix reverts to a classic wishlist ratio.