
New framework measures AI coding agent productivity gains, financial value
Serge Bulaev
A new framework may help measure how much AI coding agents improve developer productivity and business value. It suggests comparing teams using AI agents with similar teams who are not, and tracking metrics like code speed, error rates, and the share of code written by AI. The framework also includes ways to calculate possible financial savings, though these estimates depend on how well extra time is used. Monthly reports showing both speed and safety are recommended. Over time, this method might show where AI actually helps and where it does not have lasting effects.

Accurately measuring AI coding agent productivity and its financial return on investment (ROI) is a critical need for engineering leaders, moving beyond simple claims to auditable data. To meet this demand, a new measurement framework has emerged, drawing on guidance from industry leaders like GitLab and DX. This approach provides a repeatable method for converting time saved by AI into verified business value without relying on misleading metrics like lines of code.
Establish a Defensible Baseline
To accurately measure the impact of AI coding agents, establish a baseline of pre-AI performance metrics over several weeks. Then, compare a pilot group using the AI tool against a control group that is not, ensuring both cohorts work on similar tasks from the same repositories.
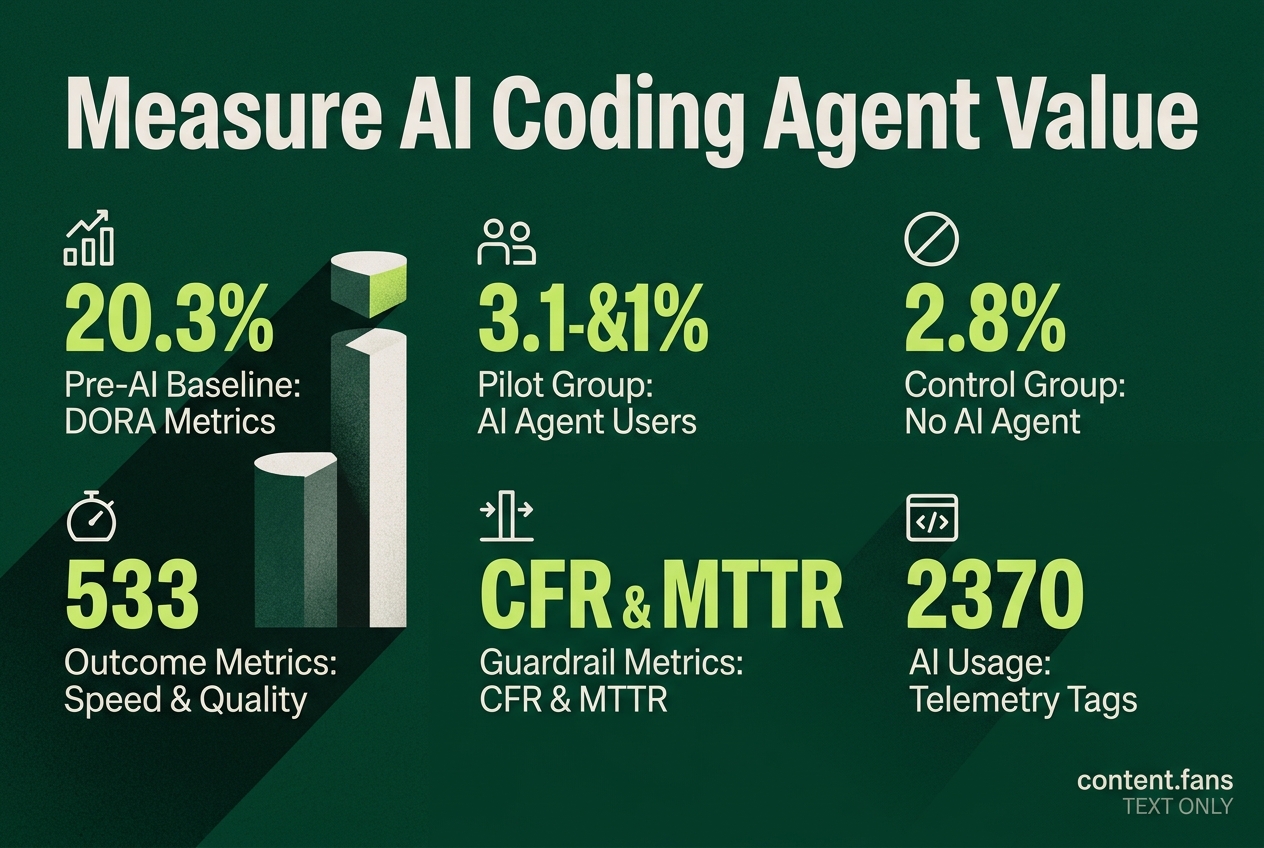
To isolate the impact of AI, a clean baseline is essential. Begin by capturing sufficient pre-rollout data from the target teams and repositories, focusing on core DORA metrics like delivery flow, code review cadence, and incident recovery. Critically, the study design must compare a pilot group using the AI agent against a matched control group that follows identical development processes. Matching repository types and ticket complexity is vital, as task mix can skew results significantly.
Track Outcome and Guardrail Metrics
Focus on outcome-oriented metrics that reflect true value delivery, not just activity. These should be balanced with guardrail metrics to ensure speed doesn't compromise quality. The DORA framework provides a proven set of metrics:
- Speed & Throughput: Track Lead Time for Changes, Cycle Time, and Deployment Frequency to confirm that AI assistance accelerates the entire delivery pipeline, not just code creation.
- Stability & Quality: Monitor Change Failure Rate (CFR) and Mean Time to Recovery (MTTR). A stable or improving CFR is a key indicator that productivity gains aren't introducing new risks.
To ensure valid comparisons, quality gates and automated test suites must remain identical for both cohorts. Many successful teams have reported significant cycle-time improvements without any rise in failure rate.
Instrument AI Usage with Telemetry
Outcome metrics show what happened, but telemetry explains why. To directly attribute performance changes to the AI agent, you must instrument its usage. Add immutable metadata tags to every AI-generated contribution, including files, commit messages, and pull request descriptions.
Key telemetry points to track include:
- AI Code Share: The percentage of committed code generated by the agent.
- Attribution Tags: An
agent-idandtoken-usagecount for each change. - Reversal Rate: The frequency with which commits containing AI-generated code are reverted.
Calculate the Financial ROI
To translate productivity gains into financial value, a simple formula isn't enough. While the baseline calculation is Hours Saved × Fully Loaded Developer Rate, a more accurate model must account for real-world inefficiencies.
A realistic ROI formula includes two critical adjustments:
- Value-Realization Factor: Acknowledges that not every saved hour becomes productive coding time due to meetings and context switching.
- Rework Discount: Accounts for the time spent fixing subtle bugs or refactoring suboptimal code introduced by AI.
For example, a developer with a significant loaded cost saving several hours per week might generate substantial annual value. However, applying appropriate realization factors and rework discounts adjusts the net value to a more realistic figure per seat.
Report on Progress and Risk
To maintain executive buy-in and guide strategy, present findings in a consolidated monthly scorecard. An effective dashboard visualizes both productivity and risk. Pair a trend chart of lead time against a bar chart showing the percentage of AI-generated code. Crucially, display the Change Failure Rate on the same view so that stakeholders can see the relationship between speed and stability. This creates a repeatable feedback loop: check adoption, review outcomes, inspect guardrails, and make data-driven decisions about scaling AI tool usage.
Why to Avoid Vanity Metrics Like Lines of Code (LOC)
It is critical to avoid vanity metrics like Lines of Code (LOC) or commit frequency, as they reward volume over value. Industry reports suggest AI agents can significantly inflate LOC while feature throughput remains flat or even declines due to the increased review burden. As guidance from sources like the DX measurement hub makes clear, LOC is not a productivity metric; it is a vanity metric that obscures downstream costs. Teams that adopt established frameworks like DORA and SPACE gain a far more accurate picture of true productivity.