New AI metrics expose hidden developer bottlenecks, boost team velocity
Serge Bulaev
AI coding tools may help engineers write code faster, but overall project speed does not always improve because most time is spent on tasks like reviewing and testing. Research suggests new AI metrics, such as Workflow Transformation Rate and AI Adoption Rate, can better show where delays actually happen. Some companies report big time savings and faster feedback by linking these metrics to business goals. Experts believe that measuring outcomes instead of just counting code may help teams find and fix hidden problems, leading to possible gains in team speed. The ongoing challenge appears to be updating measurement systems to match how work changes with AI, rather than AI not working well.

The rise of AI coding assistants has created a productivity paradox: engineers write code faster, but project delivery dates often remain unchanged. This discrepancy calls for new AI metrics that move beyond code output to expose hidden bottlenecks in review, testing, and deployment. This article explores why individual speed fails to translate to team velocity and how outcome-focused measurements can unlock an organization's true potential.
Where the Time Really Goes
AI coding assistants accelerate individual code creation, but this represents only a fraction of a developer's work. The majority of time is spent on non-coding tasks like code review, testing, and deployment, which remain significant bottlenecks and prevent overall project velocity from improving proportionally.
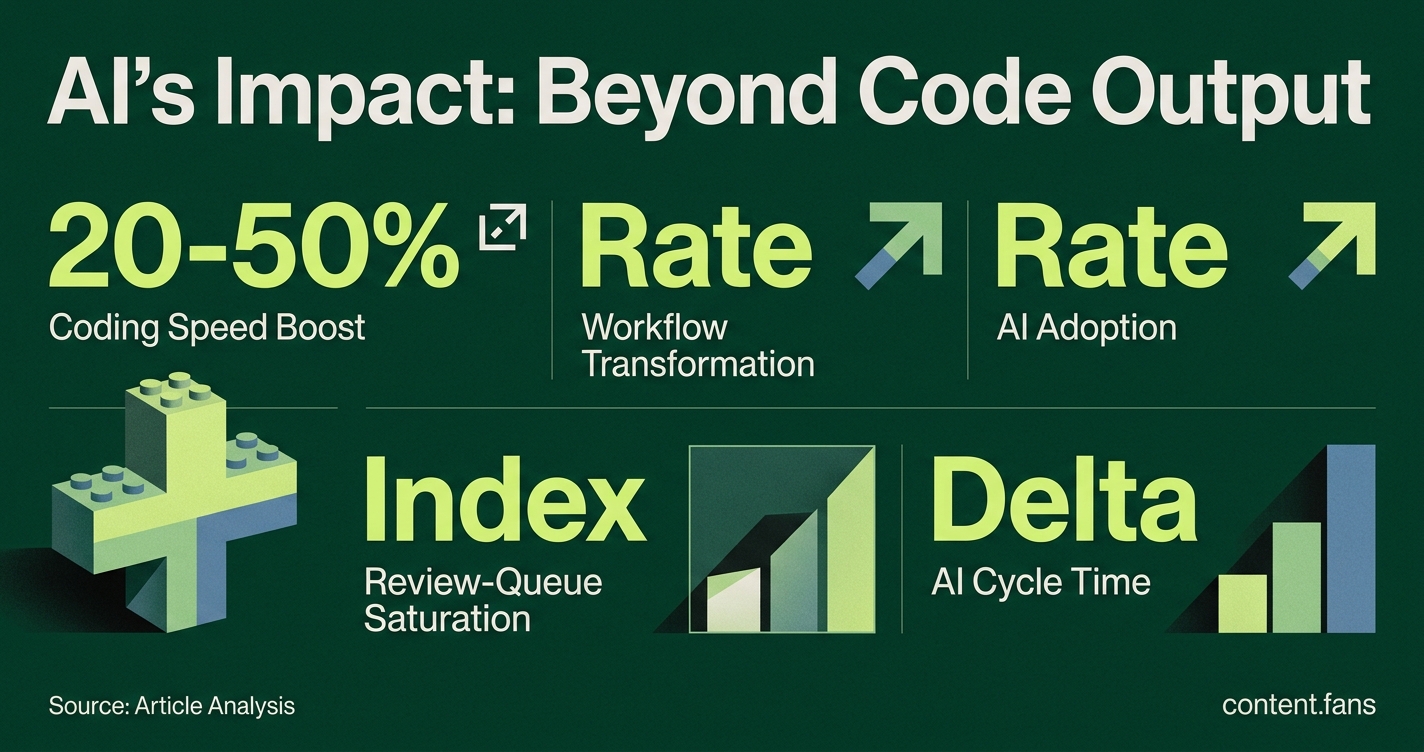
McKinsey research indicates that developers using AI tools can complete coding tasks like code generation, refactoring, and documentation 20 - 50% faster on average compared with those not using AI tools. However, this only addresses a portion of an engineer's time spent writing code. The remaining development work - review, testing, coordination, and deployment - is where real delays build up. Similarly, industry reports suggest AI-powered testing tools can significantly reduce bug detection time, yet many teams simply see review queues grow as generated code outpaces human review capacity. Case studies have highlighted this by reporting substantial rises in coding throughput but only modest gains in release velocity, pointing to downstream workflows as the new constraint.
Measuring Change Rather Than Lines
Traditional engineering metrics like commits, story points, and velocity are ill-equipped to identify these shifting bottlenecks. In response, forward-thinking teams are adopting emerging dashboards that prioritize AI adoption, workflow transformation, and tangible business value over simple output.
Industry analysis introduces the Workflow Transformation Rate, which measures the percentage of tasks from ticket to merge that use an AI-assisted path. Other critical signals to monitor include:
- AI Adoption Rate: The share of pull requests containing AI-generated code.
- AI Cycle Time Delta: The measured time saved on tasks completed with AI assistants.
- Review-Queue Saturation Index: The ratio of backlog growth against reviewer capacity.
- Developer Experience Index: Self-reported metrics on productivity and satisfaction.
- Cost to Serve Software: The total delivery cost divided by the number of finished features.
Linking Metrics to Value
Leading enterprises are already connecting these new indicators to financial and customer outcomes to demonstrate clear ROI. For instance, companies report saving significant hours by integrating large-scale code generation with their business epics in project management systems. Meanwhile, Google's Smart Test Selection system reportedly cut test execution time substantially, providing near real-time feedback that accelerated iteration loops and lowered defect escape risk.
To ensure quality, companies also track AI Rework Percentage. High rates can signal low-quality AI suggestions or poor prompting. Pairing this with a Test Depth Index helps confirm that faster output is not compromising testing coverage.
The Road Ahead for AI-Native Teams
The consensus among experts is clear: replacing vanity counts with outcome-focused metrics allows teams to surface and address systemic friction earlier. When review queues expand or defect rates climb, managers can use data to reallocate senior reviewers, bolster test automation, or refine prompting strategies - actions far more effective than pushing for more lines of code.
The productivity paradox persists not because AI is ineffective, but because our measurement systems haven't adapted to the new ways of working. Early adopters who combine metrics like AI Adoption Rate, Workflow Transformation Rate, and Developer Experience Index have reported substantial overall velocity improvements once they resolved their non-coding bottlenecks. By instrumenting the entire development lifecycle, teams can finally convert individual speed boosts into organization-wide acceleration.
Why do AI coding assistants speed up individual tasks yet leave overall delivery timelines unchanged?
AI does accelerate raw coding speed - McKinsey data shows developers using AI tools can complete coding tasks 20 - 50% faster on average, and Microsoft Research recorded increased merged PRs. However, research confirms that planning, design, testing, review, and deployment stages remain largely manual. Because only a portion of an engineer's day is spent typing code, the remaining workflow still creates the real bottleneck. In other words, AI helps developers finish the "easy" part faster, but the "hard" portion still moves at yesterday's pace.
What new metrics reveal whether AI is actually improving end-to-end velocity instead of just code output?
Teams are replacing lines-of-code dashboards with outcome-based signals:
- AI-First MAU - percentage of developers whose weekly code contains substantial AI-authored content
- Agent-assisted diffs - share of merged PRs that were touched by AI agents
- Advanced adoption - weekly active use of advanced AI features
- Cost to Serve Software (CTS-SW) - cost per delivered feature including review, testing, and operations
- Workflow Transformation Rate - percentage of tasks running end-to-end with AI participation - not just adoption percentages
Early adopters that pair these metrics with Developer Experience Index surveys see substantial overall velocity gains over time after they tackle review-queue saturation, rather than celebrating faster coding in isolation.
How are leading companies using AI to remove review and testing bottlenecks?
- Klarna's autonomous code-review agents now pre-approve low-risk PRs, removing significant senior review time and substantial operating costs.
- Google's Smart Test Selection uses ML to run a reduced portion of the historical test suite for each change, cutting test execution time substantially without losing coverage.
- Elastic has AI agents that auto-fix flaky CI builds; early results show significant time savings formerly lost to red builds.
These wins show AI can attack workflow friction, not just coding speed.
What early warning signs indicate AI is creating hidden overhead?
Look for inverse correlations between AI output and team health:
- Review-Queue Saturation Index rising faster than commit volume
- AI Rework Percentage trending high (code repeatedly edited after AI generation)
- Human Review Rate trending upward despite AI promises, showing the tool is creating more noise than value
- Defect Escape Rate climbing even as deployment frequency increases
Industry reports show enterprises experiencing faster merge approvals for AI-assisted PRs, yet seeing review volume increase substantially when junior developers lean too heavily on AI-generated code. The signal: speed without review-capacity planning creates a downstream jam.
How can teams link AI usage directly to revenue and developer satisfaction?
Business-Value Velocity - count features that move a revenue, retention, or customer-satisfaction KPI, not story points.
AI ROI Index - divide time saved + defects avoided by tooling, training, and compute spend; target break-even within reasonable timeframes.
Pair these ratios with quarterly Developer Experience Surveys; research finds teams with high developer experience scores deliver substantially more value per sprint, proving that healthy developers translate AI assistance into business impact.