Faros AI, Weave advise 4 key metrics for agent-led code
Serge Bulaev
Faros AI and Weave suggest that to measure the value of agent-led code, teams should focus on four types of metrics: adoption and usage, delivery flow, quality and stability, and cost and ROI. Adoption rates may matter most until a baseline is reached, then flow and quality become more important. Time-to-merge and review speed may reveal bottlenecks better than just counting pull requests. Quality metrics like change failure rate and mean time to recovery can show hidden problems, while cost metrics may help link code changes to business impact. The guidance suggests starting with data teams already have and warns that some metrics may look good without showing real improvements.

As engineering teams move from experimenting with AI to managing it at scale, measuring the impact of agent-led code is now a core management function. To truly understand ROI beyond pull request volume, leadership must focus on key metrics that reveal whether agent-generated changes merge efficiently and maintain code health.
The central challenge is distinguishing actionable metrics from vanity stats. Which indicators truly signal value, and which ones just look good on a dashboard?
The Four Pillars of Agent-Led Code Metrics
- Adoption and usage
- Delivery flow
- Quality and stability
- Cost and ROI
Based on guidance from Faros AI and Weave, engineering leaders should track four primary categories of metrics for agent-led code: adoption and usage, delivery flow, quality and stability, and cost/ROI. These layers provide a comprehensive view, moving beyond simple activity counts to measure true business impact.
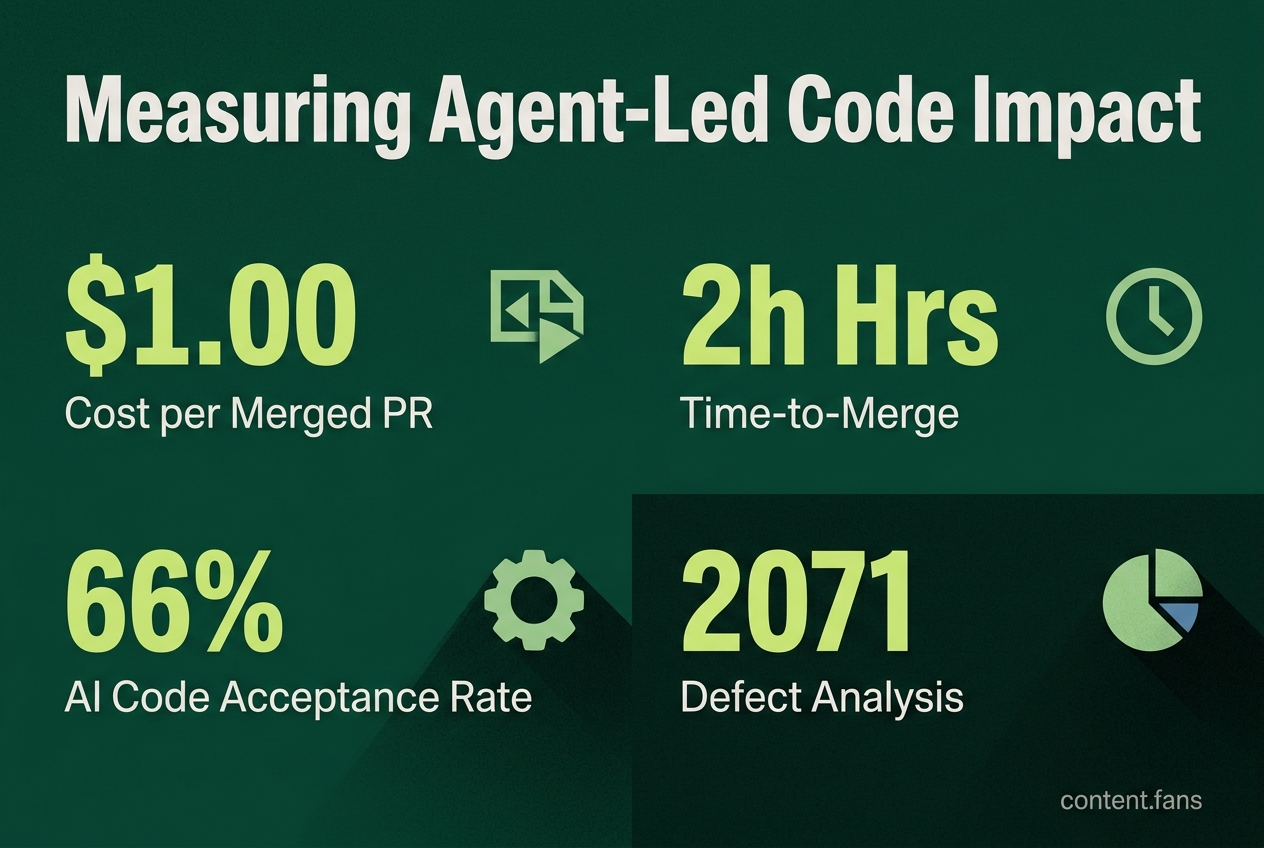
Experts recommend starting with metrics available from existing systems. Faros AI suggests beginning with cost per merged PR and time-to-merge, while Weave highlights AI code acceptance rate and defect analysis as crucial operational indicators.
1. Adoption and Usage: Establishing a Baseline
Adoption metrics answer a fundamental question: Are engineers actually using the tools? While initial usage counts are important for confirming a baseline of adoption has been reached, their value diminishes over time. Once teams regularly use AI agents, focus must shift to more sophisticated flow and quality indicators.
2. Delivery Flow: Measuring Engineering Velocity
Instead of just counting pull requests, effective teams measure flow with DORA-style metrics like lead time for changes and cycle time. For general AI agents, the vanity metric is often 'Task Volume' or 'Token Usage' if 'Task Success Rate' does not improve. For AI coding agents, 'PR Count' is a vanity metric if 'Code Quality' or 'Deployment Success' does not improve. This often signals a human review bottleneck, a common side effect of high-frequency agent commits.
3. Quality and Stability: Protecting Code Health
High PR volume can easily mask poor code quality. Key stability metrics include Change Failure Rate (CFR) and Mean Time to Recovery (MTTR). A rising CFR with a flat MTTR might be acceptable, but if both increase, it signals urgent problems. It is also critical to compare the defect rates of AI-generated code against human-written baselines to validate that agent output is genuinely improving quality.
4. Cost and ROI: Connecting Code to Business Value
To justify investment, engineering metrics must connect to financial outcomes. Cost per merged PR and compute spend per developer are two of the most effective metrics for communicating value to finance. They directly link expenses like LLM tokens and infrastructure to tangible outputs, shifting the conversation from abstract activity to concrete ROI.
A Sample Reporting Cadence
A staggered reporting schedule helps platform teams identify issues quickly without creating excessive overhead. Consider a weekly cadence:
- Monday scrape: time-to-merge, review velocity, compute spend per developer
- Wednesday audit: change failure rate, MTTR, AI code acceptance rate
- Friday finance sync: dollars per merged PR, feature completion rate per engineer-month
Key Takeaways: Avoiding Common Pitfalls
- Focus on outcomes, not activity. High activity metrics can be misleading if core indicators like feature completion rate and change failure rate do not improve.
- Pair speed with quality. A reduction in development time is only a true gain if throughput increases and quality remains high. Otherwise, engineers may be spending saved time on rework.
- Start with existing data. Avoid expensive, premature instrumentation projects. Begin by analyzing the data you already collect in your existing systems to gain initial insights without inflating costs.
How many agent PRs are top engineering orgs really merging every month?
Industry telemetry now shows tens of millions of agent-opened pull requests hitting shared codebases each month. To keep the signal readable at that scale, many teams sample a portion of those PRs and still need a governance stack that embeds time-to-merge, change failure rate, and cost per merged PR as first-class metrics. Early adopters found that raw volume alone misleads; when agent PRs doubled at one Fortune-50 org, feature completion per engineer-month stayed flat until review velocity was restored.
Which four metrics should every platform team start with?
Faros AI and Weave publish the same four leading indicators that survive scale:
- agent PR count - sampled weekly to detect usage spikes
- agent commit volume - segmented by repo criticality (tier-1 services vs. tooling repos)
- CI failure rate for agent PRs - alert when it rises above human PRs
- revert rate - tracked daily; elevated rates trigger a governance review
Dashboards that surface these four metrics as weekly trends have shown significant improvements in stakeholder trust scores across pilot programs.
How do you set alert thresholds without drowning in noise?
According to industry reports, two techniques are commonly used:
- Dynamic baseline - calculate a rolling average per repo, then trigger breach alerts
- Tiered thresholds - critical repos get stricter gates than internal tools
Industry case studies show that after applying these rules, organizations have reduced alert fatigue while still catching regressions quickly.
Can you tie agent activity directly to cost or quality wins?
Yes - but only if you join three datasets: agent usage logs, CI/CD events, and incident tickets. Cost per merged PR (Faros) and AI code acceptance rate (Weave) are the composite metrics that connect spend to shipped value. When enterprise agent roll-outs reach significant production adoption, teams that export these merged metrics to finance have shown improvements in forecast accuracy for AI spend variance.
What happens when PR volume explodes and review becomes the bottleneck?
The most common failure mode is review overload, not CI capacity. Industry reports show that after significant increases in PR velocity, human review becomes the limiting factor, not build times. The documented fix - as outlined in mabl's engineering blog - is a four-layer governance stack:
- per-repo playbooks: what agents can auto-merge vs. must escalate
- automated validation: policy checks and tests before human eyes see the diff
- shared tooling: reviewers use the same linter, security scanner, and diff viewer as agents
- human merge authority: final approval always stays with a teammate
Since deploying this stack, the company has sustained significant agent PR volumes per month without increasing reviewer headcount.