Dynatrace expands AI Observability with LLM quality metrics
Serge Bulaev
Dynatrace is adding new ways to check the quality of large language models (LLMs), not just their speed and uptime. Experts say LLMs may give answers that sound good but can be wrong or biased, so teams now watch extra metrics like accuracy and fairness. The latest advice suggests tracking things like error rates, cost, and answer quality, and connecting these with normal performance data. Quality checks may include human review for risky tasks and scheduled tests to spot problems early. Reports suggest that trust in AI systems may rise when companies combine good monitoring, clear rules, and responsible behavior from leaders.

Expanding AI Observability to include LLM quality metrics is now essential, as teams must look beyond simple latency and uptime. While large language models deliver fluent answers, they may still be inaccurate, biased, or entirely fabricated. Industry reports suggest that monitoring AI lifecycle metrics including latency, token costs, drift, hallucinations, and ethical guardrails is becoming critical for production systems (AI Observability: 2026 Guide).
This article explains how current best practices combine quality evaluation, continuous monitoring, and governance so that response integrity sits next to traditional performance telemetry.
Integrate to evaluate LLM and agent quality
Evaluating LLM and agent quality requires integrating AI-specific signals like hallucination rate and token usage with traditional performance telemetry. Teams attach a trace ID to each request, then correlate response accuracy, cost, and business KPIs with system metrics like latency and CPU usage on a single dashboard.
Modern observability stacks attach a trace ID to each prompt, retrieval, and response. This allows teams to log and correlate AI quality signals - such as token usage, retrieval precision, and hallucination rates - with standard service metrics like latency and CPU/GPU load, as outlined in guides like LLM Observability in 2026. This unified view enables operators to diagnose if a drop in answer relevance correlates with performance issues, model updates, or traffic spikes.
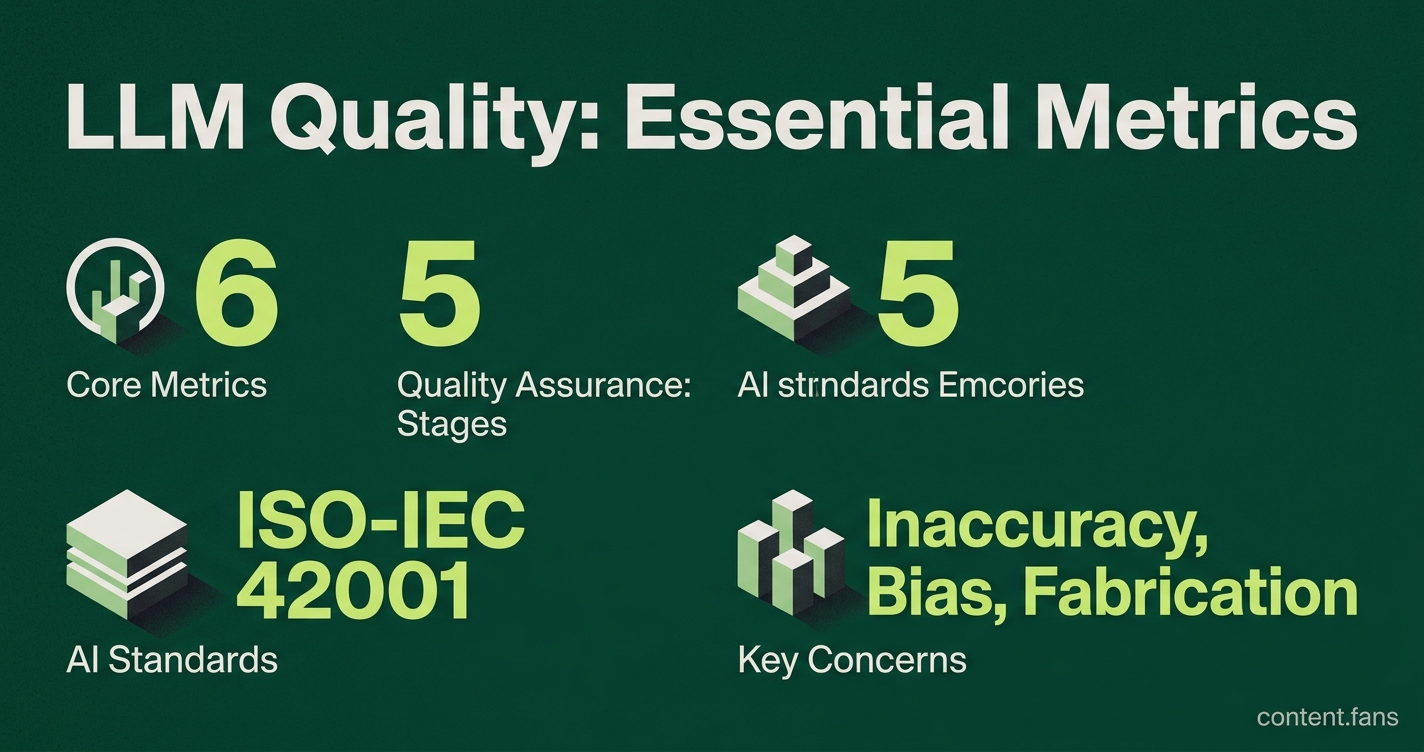
Most teams begin by tracking six core metrics: latency, error rate, token cost, retrieval precision, answer faithfulness, and a business KPI like containment rate. They later add guardrails for concerns like toxicity. Scheduled evaluations against golden datasets can detect model drift before it impacts users, triggering alerts on composite signals such as "quality down + tool failures up".
Quality assurance workflow for ungrounded outputs
Industry reports suggest that comprehensive AI quality assurance programs now span risk classification, data governance, validation, drift detection, and incident response, often aligned with standards like ISO-IEC 42001 (AI Quality Assurance isn't Optional). A typical staged workflow involves:
- Defining scope and pass criteria pre-development.
- Testing against separate validation and edge-case datasets.
- Incorporating human review for high-risk applications.
- Monitoring for model drift and retraining as performance decays.
Common toolchains pair data validation tools like Great Expectations with model testing platforms such as Deepchecks or Evidently AI. Experts advise starting with a single workflow and tool to limit false positives and demonstrate clear ROI before scaling the program.
Trust and business impact
A lack of trust is a primary barrier to capturing value from AI. Industry reports indicate that many enterprises remain "stuck in pilot mode" because their systems hallucinate or lack transparency (State of AI trust in 2026). The key risk is a lack of visibility into how AI operates within complex workflows. To build trust, observability data, QA scores, and audit logs must be converged, enabling leaders to trace who changed a prompt, when drift started, and which users were affected by errors.
Cultural factors are equally critical. Research suggests that employee trust increases significantly when leadership models responsible AI use. This highlights that scaling high-stakes LLM agents depends as much on organizational behavior as it does on technical metrics.
What makes AI quality failures different from traditional software bugs?
Traditional software fails with visible crashes or error codes. AI systems can return responses that look perfect - fast, well-formed, and error-free - yet contain hallucinations, unsupported claims, or toxic content. This silent failure mode is why response quality, factual grounding, data security, and usability must sit beside the same latency and availability charts operators already trust.
How are leading teams integrating LLM quality metrics into existing observability pipelines?
Teams start by attaching a shared trace ID to every request. Infrastructure metrics (CPU, GPU, memory, latency, errors) join AI-specific signals (token count, retrieval precision, hallucination rate, faithfulness, safety score) and business KPIs (CSAT, containment, cost per task) in one dashboard. The correlated view lets engineers see quality drops alongside resource spikes or model changes, so they can alert on composite signals like "quality down + latency up" rather than chasing single thresholds in isolation.
Which concrete metrics best catch ungrounded or inaccurate LLM answers?
Practitioners track:
- Hallucination rate - share of answers that introduce unsupported facts
- Faithfulness / answer relevance - cosine similarity between generated text and retrieved passages
- Retrieval precision & recall - whether the right chunks were fetched
- Golden-set pass rate - percentage of curated test questions answered correctly
- Human-review rate - low-confidence outputs routed to a person
These metrics are baked into CI/CD and nightly eval jobs, then compared with live traffic baselines to spot drift days before users complain.
Why are evaluation scores in spreadsheets or CI logs hard to operationalize?
Spreadsheets and build artifacts lack trace context, so engineers cannot tie a failing eval row to the exact model version, prompt template, or downstream service latency that produced it. Disconnected data means quality regressions surface only after the bad model is promoted. Centralizing eval results in the same column store as system telemetry fixes this blind spot.
Where should a team start if resources are limited?
Start with five metrics:
1. Request latency
2. Token cost
3. Retrieval precision
4. Faithfulness score
5. One business KPI (e.g., containment rate)
Export them through OpenTelemetry into the monitor you already pay for. Add scheduled golden-set evals and an alert that fires when three-sigma deviation hits any two of the five metrics. This minimal set catches many production hallucinations and cost spikes without new infra, according to industry reports.