Cognite, NVIDIA integrate AI for industrial predictive operations
Serge Bulaev
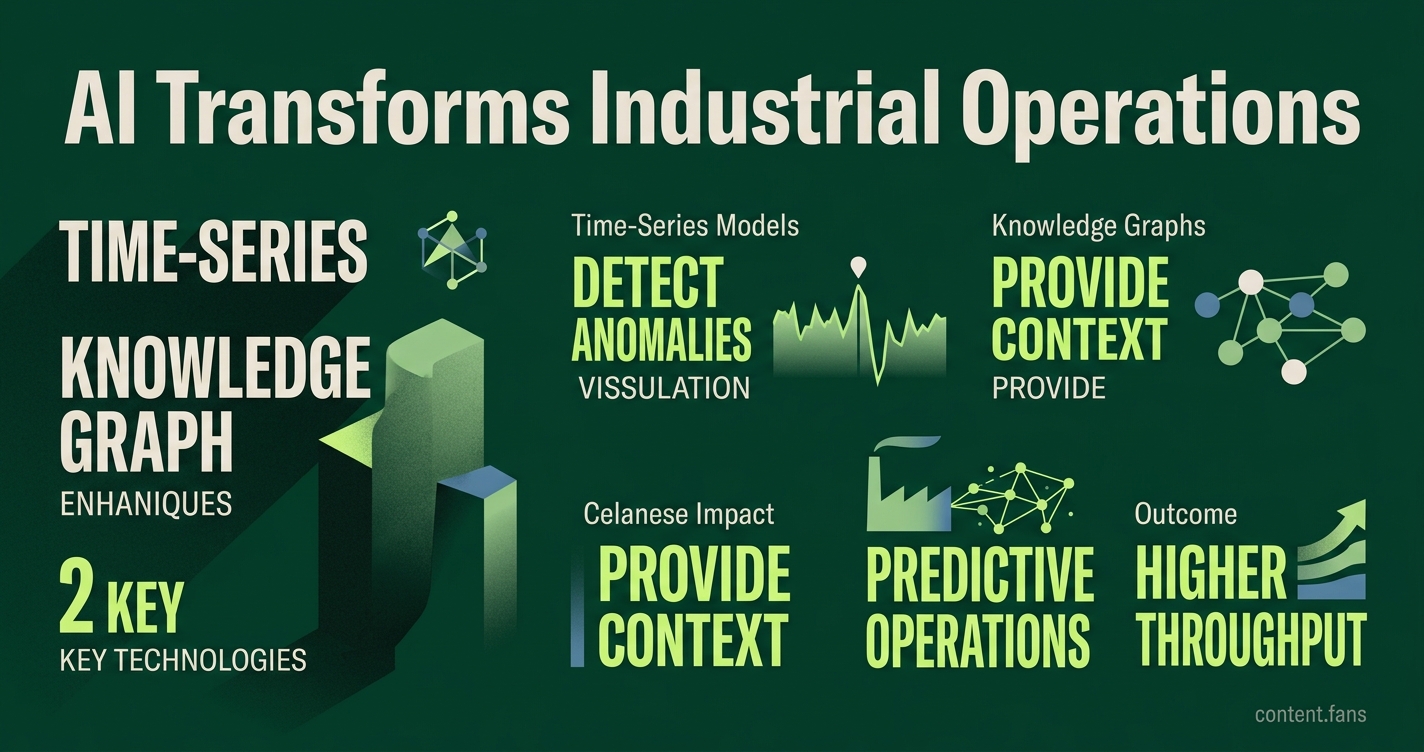
Cognite and NVIDIA have combined their technologies to improve predictive operations in industrial settings. Time-series models can detect unusual patterns, but knowledge graphs add important context by linking sensor data to asset relationships and business impact. The integration at Celanese's Texas facility reportedly helped move from manual checks to predictive operations, which may have improved efficiency. Data integration remains challenging because information is stored in many different systems. Experts suggest that success should be measured by business outcomes like reduced downtime, not just technical model metrics.

The integration of Cognite's data platform and NVIDIA's AI technology is transforming industrial predictive operations by bridging the gap between raw data and actionable intelligence. This partnership combines high-frequency time-series models, which excel at pattern detection, with industrial knowledge graphs that provide critical context about asset relationships and business impact. At Celanese's Texas facility, this integration enabled a shift from manual checks to predictive operations, improving site efficiency. However, success hinges on overcoming data integration challenges and measuring business outcomes like reduced downtime rather than just model accuracy.
Why Time-Series Models Alone Are Not Enough
Industrial AI achieves predictive accuracy by combining two key technologies. Time-series models analyze high-frequency sensor data like pressure and temperature to detect anomalies. A knowledge graph then enriches these anomalies with crucial context, mapping sensor data to specific assets, their operational importance, and potential business impact.
Time-series models are powerful pattern detectors, ingesting signals like pressure, vibration, and temperature to flag deviations from historical norms. Their limitation is a lack of context; an alert on a utility pump is treated the same as one on a critical reactor. To address this, industry reports note the growing adoption of knowledge graphs to provide the asset hierarchy and metadata needed for prioritization.
A knowledge graph maps these complex relationships: which sensor belongs to which asset, how assets connect in a process, and the financial cost of past failures. When a model flags an anomaly, the graph instantly contextualizes it, answering questions like, "Is this asset mission-critical?" and "What is the potential cascading downtime cost?" This crucial step transforms raw alerts into prioritized, actionable tasks.
In Practice: The Celanese, Cognite, and NVIDIA Integration
A notable application of this approach is at the Celanese facility in Clear Lake, Texas. In March 2026, Cognite announced the integration of its Industrial Knowledge Graph with NVIDIA's NV-Tesseract forecasting models to enhance predictive accuracy (link). This synergy allowed the site to transition from manual sampling to fully predictive operations, resulting in higher throughput and asset efficiency. Cognite says its Industrial Knowledge Graph provides context-rich industrial data that powers NVIDIA's time-series AI, helping identify equipment issues earlier and make forecasts more actionable.
The Core Challenge: Unifying Disparate Industrial Data
The primary obstacle to implementing this technology is data fragmentation. Industrial data is typically siloed across multiple systems: historians contain sensor tags and measurements, while CMMS and EAM systems store work orders and asset metadata. As SymphonyAI cautions, relying on a rigid, historian-centric asset hierarchy can create data silos and make the knowledge graph fragile (link). A successful implementation requires a composable, historian-agnostic architecture with automated mapping rules - validated by subject matter experts - to link thousands of tags to a unified asset model.
Key hurdles to building a robust knowledge graph include:
- Vendor lock-in when one historian defines the asset tree
- Manual tag-to-asset mapping that does not scale
- Incomplete source coverage across historians, CMMS, ERP, and P&IDs
- Ontology alignment and data-quality profiling tasks
- Continuous governance so the graph reflects equipment changes
Measuring What Matters: From Model Metrics to Business KPIs
Experts emphasize that the success of industrial AI should be measured by business KPIs, not abstract model metrics. Teams focusing solely on technical precision and recall often fail to demonstrate meaningful returns. Instead, success should be quantified by avoided downtime costs, improvements in throughput, and reductions in manual maintenance hours. By assigning a dollar value to each predicted event, the knowledge graph enables operations teams to instantly prioritize which forecasts demand immediate attention.
While a time-series model alone might optimize an isolated control loop, it can cause operational harm if it pursues the wrong metric without understanding the broader context. Layering a knowledge graph mitigates this risk by exposing causal links and physical constraints. This defines the true meaning of context in industrial AI: a structured, continuously governed map of assets, relationships, and business impact that enriches every prediction.