Acosta unveils new retail metrics for fresh food success in 2026
Serge Bulaev
Acosta's new study suggests that retailers may start measuring success in fresh food by shopper confidence and category growth, not just profit. Key areas might include how available and fresh items are, how much waste is controlled, and how shoppers feel about quality. Early tests show that focusing on quality and customer satisfaction may reduce waste and increase loyalty, but results are still early and could change. These new ways of measuring could help stores turn their fresh departments into loyalty drivers instead of just cost centers.

Retailers are shifting their strategy for fresh food success, moving beyond margin-focused assessments to embrace holistic approaches centered on value, relevance, experience, and trust. According to Acosta Group's 2026 consumer predictions, relying on gross profit alone overlooks critical store-level value generated by repeat customer visits, willingness-to-pay, and sales across other categories.
Industry advisors recommend a revised scorecard built on two pillars: operational excellence to guarantee freshness and shopper-centric outcomes to build trust. Underscoring this, industry reports indicate that a significant portion of shoppers prioritize quality and freshness above all else, indicating that new confidence metrics can effectively track what truly drives weekly purchasing decisions.
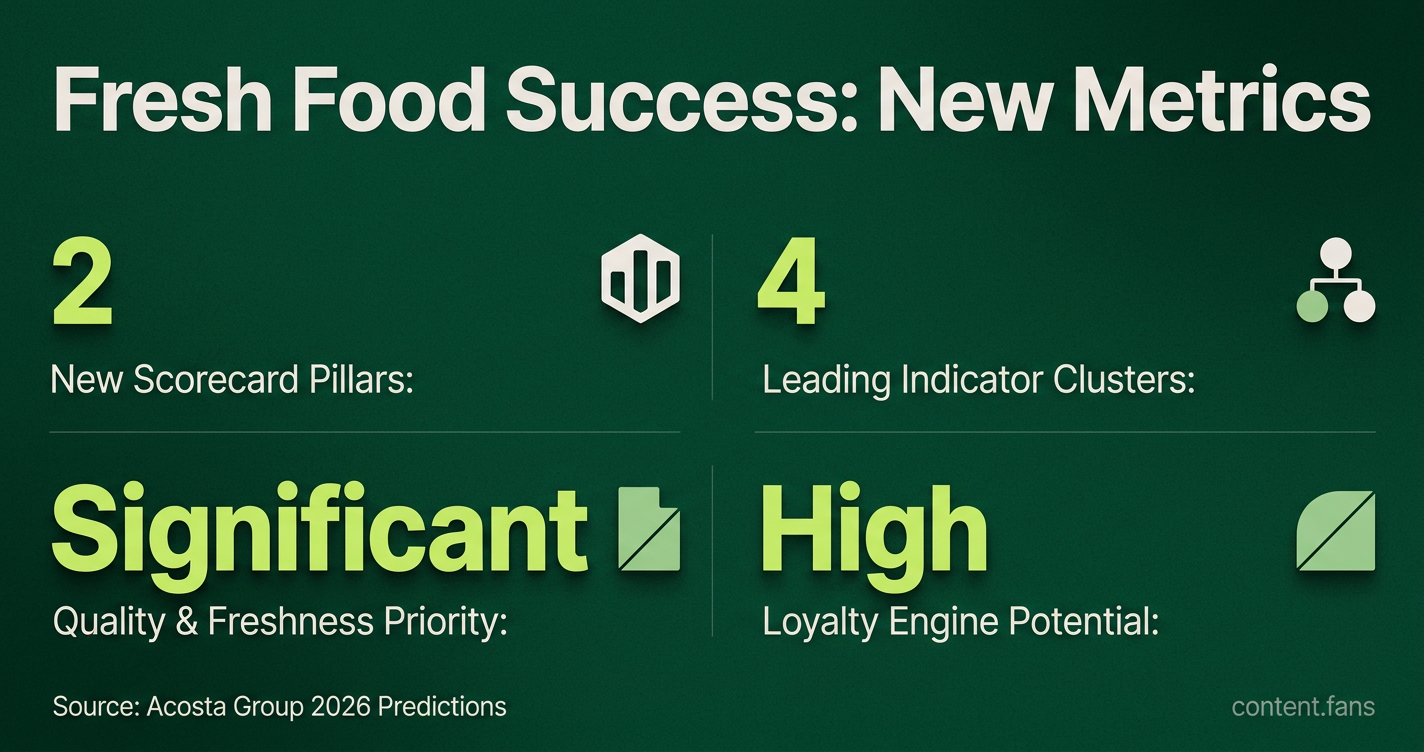
Measure fresh success by shopper confidence and category growth, not margin alone
A new framework for measuring fresh food performance combines operational data with customer-focused outcomes. Key indicators include on-shelf availability, waste control, shopper engagement across trips, and direct feedback on quality perception. These metrics provide a more holistic view of a department's health beyond simple profit margins.
Industry guidance organizes these leading indicators into four primary clusters:
- Availability: on-shelf rate and forecast accuracy for short shelf-life items.
- Waste control: shrink percentage and markdown effectiveness reported daily.
- Engagement: basket attachment, units per trip, and digital conversion for perimeter items.
- Quality perception: customer freshness scores and complaint counts compared with peer banners.
Experts advise pairing these shopper-focused metrics with A/B tests across matched stores. For instance, industry reports suggest that a localized assortment might deliver a slightly lower margin but still expand total category sales by lifting perceived quality scores.
What early pilots are showing
Early pilots demonstrate the power of this new approach. Industry case studies show retailers placing quality perception at the core of their dashboards for meat and seafood, which reportedly reduced shrink while increasing loyalty visits. Similarly, research links improved cold-chain compliance to longer product life at home, directly reducing customer complaints.
Furthermore, FMI trend monitoring reveals that chains tracking basket size and visit frequency for fresh departments see higher trip counts from their core customers. While promising, analysts caution that these results are still directional, as pilots have been limited by geography and seasonal variations.
Taken together, these new KPIs transform fresh departments from cost centers into powerful loyalty engines. This model empowers store teams to focus on maintaining stock, curating the product range, and proactively addressing dips in freshness ratings to protect store traffic. Several retail chains are already piloting these expanded dashboards across their networks.
Why is margin alone no longer enough to measure fresh department performance?
Industry experts warn that margin-only analysis hides the true return on fresh assortment decisions. When a new organic berry line drives higher shopper confidence but only adds modest gross margin, the margin figure alone makes the program look expendable. By layering in shopper confidence scores, repeat purchase rates, and willingness-to-pay premiums, retailers can finally link added SKUs to bigger baskets and longer-term loyalty instead of just short-term profit.
What new KPIs should retailers consider?
A practical dashboard adds shopper-focused metrics:
- In-stock rate - industry reports suggest stock-outs significantly impact fresh sales
- Perceived freshness score - gathered via post-purchase SMS surveys
- Conversion rate from entry to purchase - measured by store-level POS and Wi-Fi pings
- Repeat purchase within 14 days - tracked through loyalty IDs
- Cross-category attach rate - e.g., deli meat added to bakery bread
- Markdown effectiveness - shrink saved per reduced-price unit
These replace older, purely financial KPIs such as average gross margin percent.
How do we run reliable A/B tests on fresh assortment changes?
Industry experts recommend store-level, two-week A/B cycles:
- Multiple stores receive the new assortment, others act as controls
- Use identical weather, day-of-week, and promotional calendars to isolate the change
- Measure the new KPIs above plus waste rate
- A meaningful lift in basket size or repeat purchase proves the test a winner
- If shrink rises significantly without corresponding sales lift, roll back
Early pilots report higher fresh department penetration when tests are followed by chain-wide rollouts.
What real-world evidence shows these new metrics work?
Industry studies found that chains using freshness perception scores grew fresh sales faster than those using only margin. One regional grocer reduced SKUs yet saw perceived variety rise after reorganizing displays by meal solution rather than by supplier. The key was curated breadth - shoppers felt more confident in quality when assortment felt intentional.
How is the new balanced scorecard being built at the headquarters level?
Leading teams are moving to an integrated weekly dashboard that combines:
- Operational data: forecast accuracy, shrink, on-shelf availability
- Shopper data: confidence score, CSAT, repeat rate, willingness-to-pay index
- Commercial data: promo ROI, attach rate, digital conversion
A color-coded heat map flags any KPI drifting outside its target band; buyers and supply-chain planners meet regularly to correct issues before weekend traffic peaks. Early adopters report lower waste and higher fresh basket size within one quarter.