New Report Maps Enterprise AI Spend to Maturity
Serge Bulaev
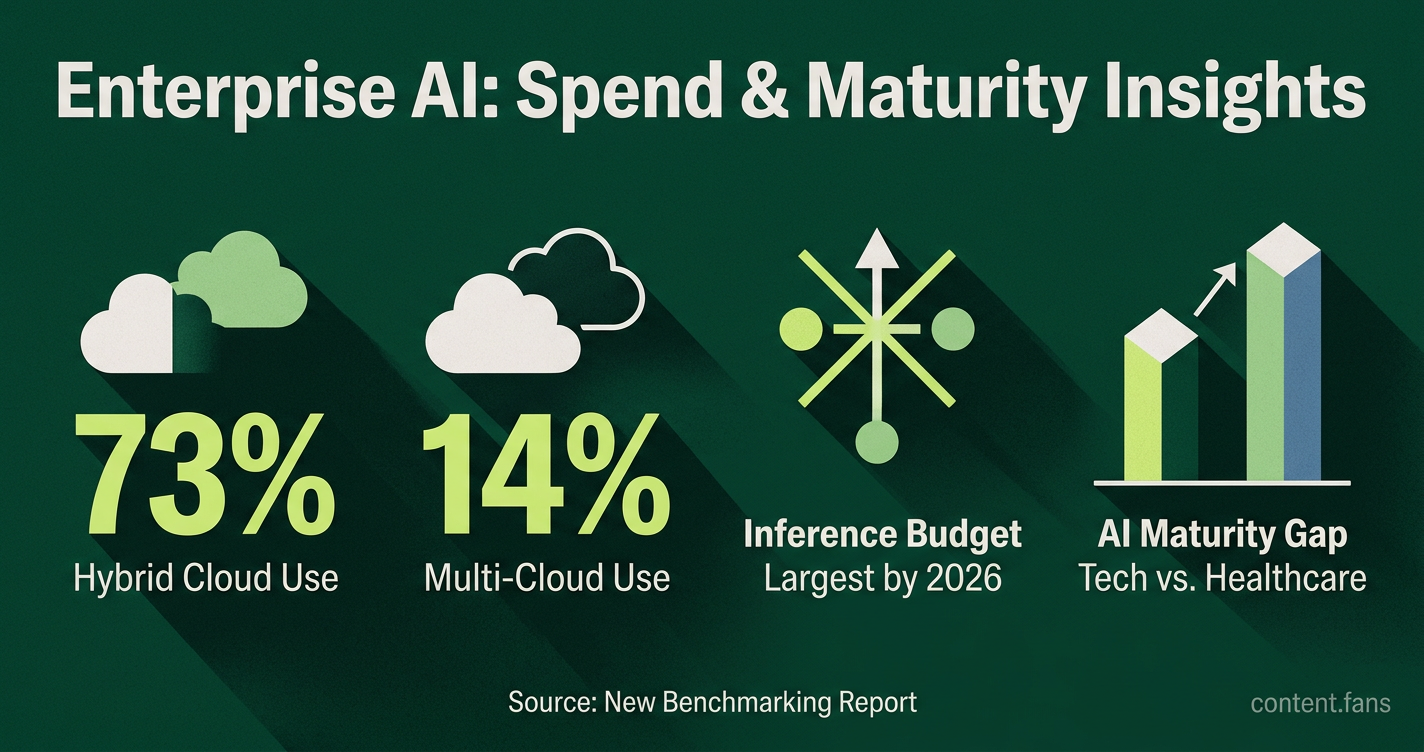
A new report idea suggests linking enterprise AI maturity to infrastructure spending, using survey data and industry frameworks. Studies from Deloitte and MIT CISR show that companies are at different AI maturity stages, with tech industries scoring higher than healthcare. Most firms seem to prefer hybrid cloud strategies, and spending may shift more towards inference workloads by 2026. The report could include simple charts to help companies compare themselves and may be published in stages, with some content free and some behind a sign-up. The timeline for this report appears to align with budgeting cycles and major industry events.

A new benchmarking report maps enterprise AI spend to maturity, providing a vital reference for executives. By pairing primary survey data with established industry frameworks, the report details how peer organizations allocate budgets and select infrastructure. This analysis, drawing from studies by Deloitte and MIT CISR, outlines how this data can guide strategic decisions for CIOs, CTOs, and vendor strategists.
Segmenting enterprises by AI maturity
Enterprises are segmented by AI maturity using frameworks that track budget allocation, governance, and business impact. Studies from MIT CISR and Deloitte categorize firms into stages, from initial experimentation to being "AI Future Ready," allowing for direct comparison of infrastructure spending and strategic priorities across industries.
MIT CISR's AI Maturity study identifies stages such as 'Adventurers', 'Experimenters', 'Pragmatists', and 'Transformers', with varying firm distributions across these categories link. A parallel Deloitte study highlights significant industry disparities, with Tech/SaaS firms having higher maturity than Healthcare, though specific median scores require further verification. This gap underscores the need for benchmarks that capture both leaders and laggards. AI budget share varies by maturity stage, with more mature organizations typically allocating larger portions of their IT budgets to AI initiatives.
Infrastructure preferences and workload placement
According to Flexera's 2026 State of the Cloud Report, 73% of organizations use hybrid cloud (with an additional 14% using multi-cloud without private cloud). Workload placement is strategic: industry trends indicate a shift toward hybrid infrastructure, with on-premises deployments for baseline and sensitive workloads, and cloud for burst capacity. On-premises adoption is rising for high-utilization inference workloads to control latency and costs, while elastic public clouds are favored for training. Furthermore, planned spending is shifting significantly towards inference. S&P Global data shows inference is expected to become the largest budget category by 2026, overtaking data preparation and model training.
Packaging the benchmarking output
The report is packaged in a tiered content model to maximize reach and support lead generation:
- Free executive summary with key charts and maturity heat map.
- Gated PDF containing workload-level spend distributions and vendor share splits.
- Spreadsheet pack with TCO calculators that let buyers input their own volumes.
- Webinar series timed to VB Transform 2026.
While interactive calculators are known to have high conversion rates for gated content, specific conversion metrics vary by implementation and audience. To optimize lead quality and reduce friction, a short sign-up form is presented after users can preview sample outputs.
Recommended data visualisations
The report includes a concise set of data visualizations to help readers quickly benchmark against their peer group:
- Stacked bar chart: AI budget share by maturity stage.
- Bubble plot: Industry on x-axis, median maturity on y-axis, bubble size by headcount.
- Heat map: Preferred infrastructure across training, inference and edge workloads.
- Distribution plot: Cloud cost per employee based on organizational characteristics.
Distribution timeline
The report's distribution is timed to align with enterprise budgeting cycles and key industry events. Following the close of survey fieldwork in Q1 2026, the executive summary will be published in Q2. Gated assets will be released ahead of mid-year budget planning to maximize relevance, while conference alignment aims to boost citation and reinforce the report's authority.