
New framework measures AI coding agent productivity, ROI
Serge Bulaev
A new framework may help organizations measure if AI coding agents really improve developer productivity, since results from public studies are mixed and sometimes show slower task completion. The framework suggests collecting baseline data before using AI, tracking metrics like AI code rework, incident rates, and time saved. Teams should tag files created by AI and use control groups to better see the AI's real impact. Financial results might be calculated by comparing hours saved to the cost of tools, but reported productivity gains may only be about 2.1 percent after costs. The results should be shown together in a dashboard to make sure improvements are real and not just about speed.

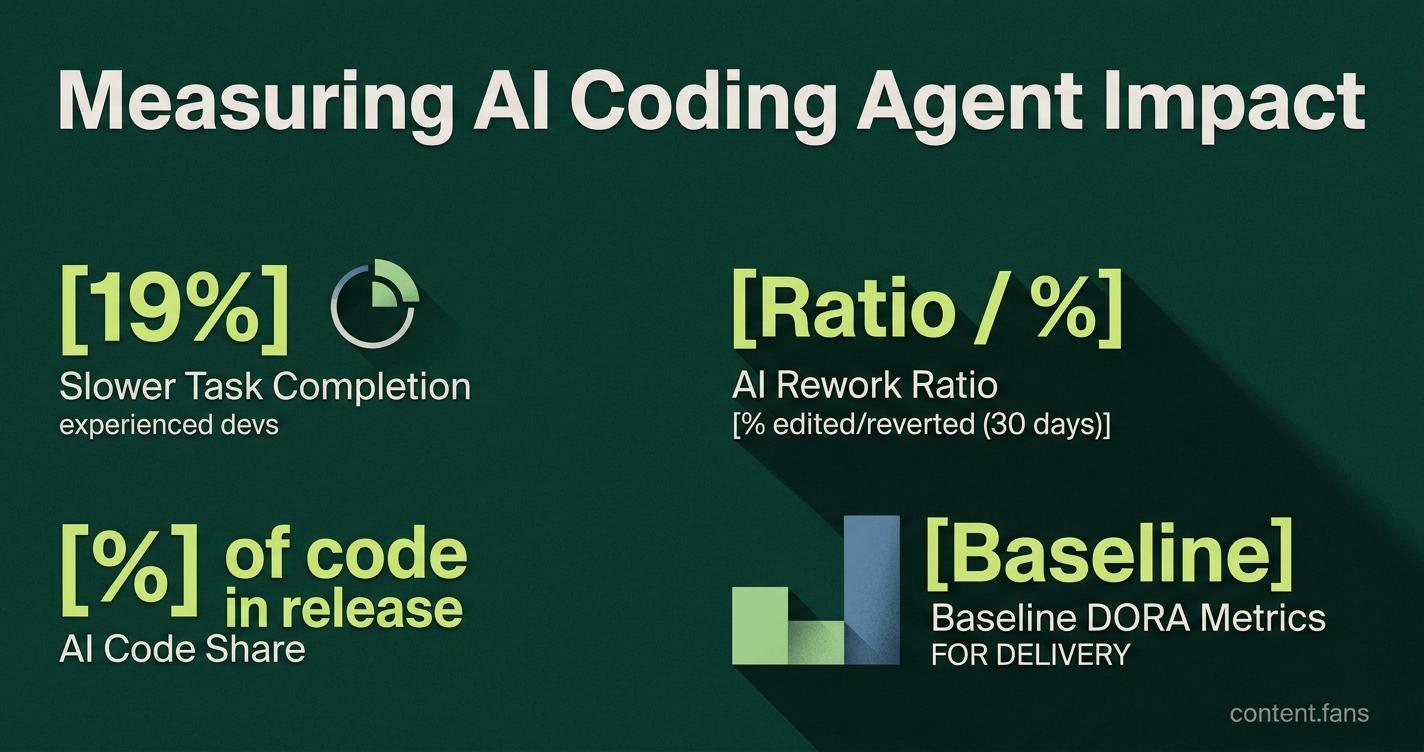
Measuring AI coding agent productivity presents a common challenge: developers feel faster, but leadership questions the actual business impact. While teams report anecdotal gains, public studies cite mixed results, including a reportedly 19 percent slower task completion time for experienced open source developers using code assistants, according to the February 2026 METR update (METR cohort data). To move beyond subjective feelings and create a clear business case, organizations need a repeatable measurement playbook.
This article presents such a playbook in three parts.
Establishing a reliable baseline
To accurately measure productivity, engineering leaders should first establish a pre-AI baseline using DORA metrics. Then, track AI-specific indicators like the rework ratio of generated code and the cycle time of AI-assisted pull requests. This dual approach separates raw output from tangible, high-quality delivery improvements.
To establish a reliable baseline, collect performance data for at least one full release cycle before introducing any AI tools. This prevents seasonal demand from skewing results. Start with core DORA delivery metrics: deployment frequency, lead time for changes, change failure rate, and time to restore service. As Exceeds AI notes, focusing on delivery outcomes is crucial because AI can increase code output without enhancing system reliability (AI-era delivery metrics). Segmenting this baseline data by team, repository, and task complexity will help isolate the AI's specific impact later.
Framework: Measuring Developer Productivity Gains from AI Coding Agents metrics stack
Key metrics for evaluating AI impact include:
- AI-Touched Pull Request Cycle Time: Compare the speed of PRs with and without AI contributions.
- AI Rework Ratio: Calculate the percentage of AI-generated code that is edited or reverted within 30 days.
- Longitudinal Incident Rate: Track incidents linked to AI-generated code over time.
- AI Code Share: Measure the proportion of AI-generated code in each release.
- ROI or Value-Realization Score: Quantify the financial return.
To enable this tracking, tag every agent-generated file or comment automatically upon creation and log token usage. By combining these tags with developer time-tracking or IDE sampling, teams can accurately estimate hours saved at the individual task level.
Attribution and financial conversion
Use cohort analysis or staggered rollouts to isolate the AI's impact from other variables. A common approach involves creating control groups and early-adopter teams, then comparing their cycle time deltas using a two-sample t-test. If quality metrics like defect rates hold steady while cycle time decreases, the improvement can be confidently attributed to the AI agent.
For finance alignment, translate time saved into avoided labor cost:
Dollar savings = (hours saved × fully loaded developer rate) − licence and observability spend
According to data summarized by Axify, median programs report a net productivity uplift of around 2.1 percent after accounting for costs, though results vary significantly (Axify summary). This figure should be adjusted downward to account for any rework or incident remediation tied to AI code during the quarter.
Finally, consolidate all findings into a unified dashboard. Presenting cycle time improvements alongside rework rates, incident data, and ROI panels ensures a balanced view of performance, preventing teams from celebrating speed gains that compromise quality.
What core metrics should a team track to prove AI coding agents are actually improving productivity?
Track delivery metrics first, then layer on AI-specific signals.
Start with the four classic DORA metrics:
- deployment frequency (how often code reaches production)
- lead time for changes (commit-to-production duration)
- change failure rate (deployments that break something)
- time-to-restore service (MTTR after incidents)
Next, add AI-touched indicators that isolate agent impact:
- PR cycle time for changes that include AI-generated code vs human-only changes
- AI rework ratio - the percentage of AI code edited or rolled back within 30 days
- AI code share - the share of merged lines that were agent-generated
Teams that monitor these six numbers can quickly spot "faster but worse" false positives and show leadership a concise, evidence-based dashboard.
How do we instrument our tools to capture those numbers without slowing developers down?
Keep the overhead invisible to engineers.
1. Tag every diff with a lightweight commit-message flag (ai-gen, human) added automatically by the IDE plugin.
2. Log token or LLM calls at the CI layer - one line per build showing agent, endpoint, and cost.
3. Join CI logs to your existing observability pipeline (GitHub Actions, GitLab, Jenkins) so metrics surface in the same dashboards teams already watch.
4. Combine with time-sheets or IDE telemetry to translate raw events into hours saved and then into financial value.
The total setup takes less than a sprint and reduces the average data-gathering overhead to near zero while still giving finance-grade audit trails.
How do we separate real agent gains from other process changes that happened at the same time?
Use cohort experiments and statistical control.
- Split teams (or repositories) into two matched cohorts: one with agents enabled, one without.
- Run for 4-6 weeks, then run a difference-in-differences test on cycle time and defect rate.
- Include confidence intervals - the latest METR update shows early results varying from -18 % to +8 % depending on task complexity, proving that single-point claims are unreliable.
- Document the rollout timeline so you can control for any concurrent process updates (new linters, CI changes,, org re-structures).
Teams that follow this protocol avoid the most common pitfall: crediting agents for improvements that came from process tweaks or senior hires.
What is a defensible way to turn "hours saved" into dollars our CFO will believe?
Apply the loaded-rate model:
[ \text{ROI %} = \frac{(\text{Engineer-hours saved} \times \text{Fully-loaded hourly cost}) - \text{Total AI tool cost}}{\text{Total AI tool cost}} \times 100 ]
- Fully-loaded cost = salary + benefits + overhead (typical range in North America: \$120 - \$180/hour).
- Total AI tool cost must include license, integration, evaluation, observability, and human QA time.
- Adjust for rework: if the AI rework ratio is 25 %, cut the hours-saved figure by that fraction.
Using this method, recent engineering velocity transformations in industry data showed 6.1x ROI within a year, but only when the full cost stack was included in the denominator.
How long should we measure before we can trust the ROI numbers?
Measure at least two quarterly cycles and look for both early and latent effects.
- Weeks 1-4: capture the speed-up halo - often +10 - 20 % PR throughput.
- Weeks 5-12: watch for increased review load or defect bounce-back.
- Months 3-6: monitor longitudinal incident rate tied to AI-generated code - some defects surface only after production usage.
Industry benchmarks in 2025 show the median AI program reaches a stable 2-4x ROI window only after 12 full months of measurement, because rework and knowledge-transfer costs show up later.