
Investors demand new metrics for agentic coding ROI, costs
Serge Bulaev
Investors are seeing many bold claims about agentic coding, but costs may rise quickly and are hard to predict. Field studies and reports suggest that most of the spending goes into input tokens and code reviews, with ratios as high as 25 input tokens for each output token. The best metrics for understanding value may include speed, quality, cost per feature, and business impact, but there are risks if companies cannot clearly explain costs and outcomes. Some signs of concern might be vague answers about token usage, no baseline data, or using only basic productivity measures.

Investors evaluating agentic coding breakthroughs require a clear playbook for measuring ROI and validating ambitious claims. While pitch decks promise transformative results, understanding the real-world financial impact is critical, as costs can escalate unexpectedly. This guide outlines key metrics and diligence questions based on recent field studies, focusing on the relationship between token consumption, productivity gains, and profitability.
Where the Bills Appear
Agentic coding costs primarily originate from high token consumption and intensive human oversight. Field studies show that a significant portion of spending is dedicated to input tokens used to provide context and the subsequent code review cycles. The study found that code review used 59.4% of tokens and input tokens made up 53.9% of total usage, implying a much smaller input-to-output ratio than previously assumed.
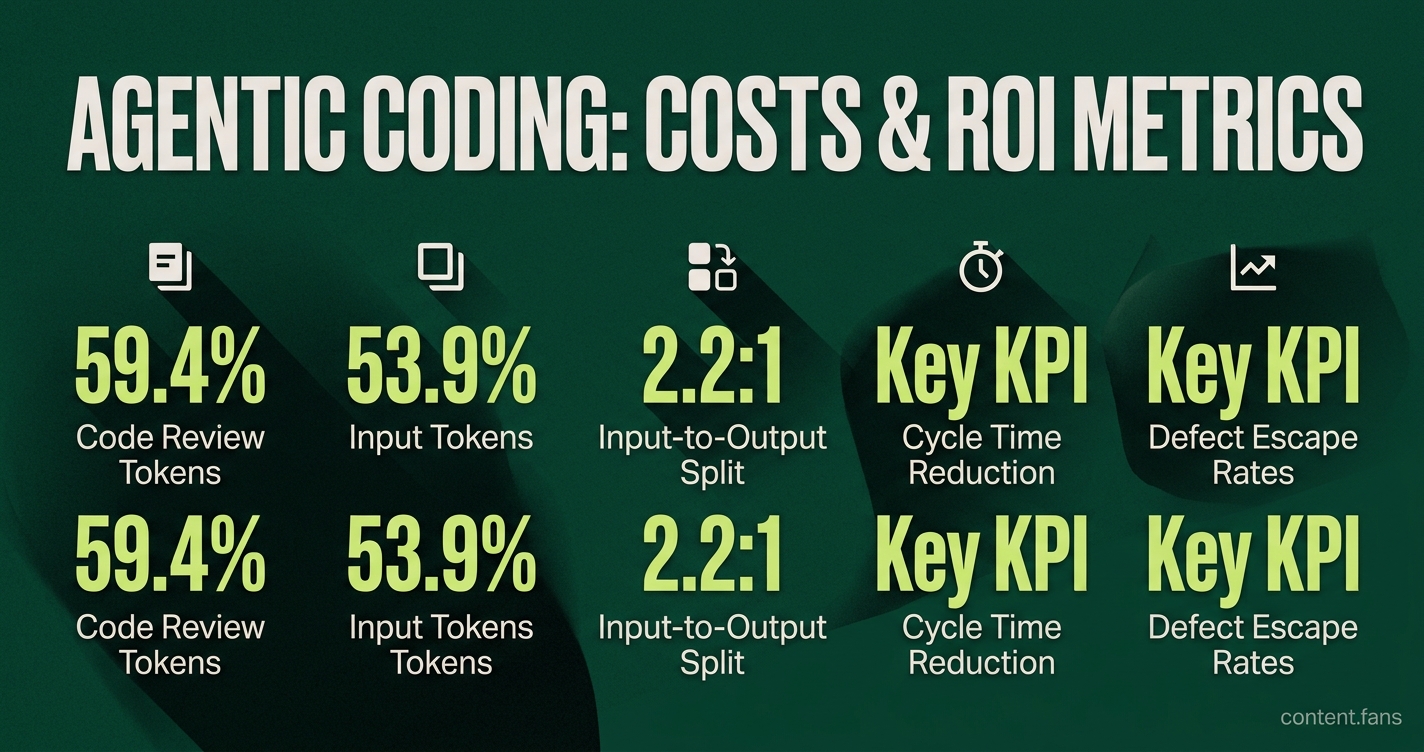
For example, a study of the ChatDev framework found that code review and input prompts account for 59.4% and 53.9% of total tokens per run, respectively (Quantifying Where Tokens Are Used). Vendor data reinforces this, with analysis showing the best-supported figure from the original paper is about a 2.2:1 input-to-output split overall (Hidden Cost Driver). This variability makes token budgets difficult to predict, leading investors to demand workflow-specific cost models instead of simple blended averages.
Metrics That Travel From Dev Floor to Board Deck
To measure true business value, investors should look beyond simple productivity gains. A comprehensive framework connects engineering metrics to financial outcomes, such as conversion increases or risk mitigation (Quantifying Agentic ROI). The most effective KPIs include:
- Cycle Time Reduction: Measured against a pre-deployment baseline established by the organization.
- Quality and Stability: Changes in defect escape rates and change failure rates.
- Cost Per Task: A total cost accounting for labor, licenses, and rework.
- Adoption Rate: The percentage of AI-generated suggestions accepted by developers.
- Business Impact: Measurable revenue or retention gains linked directly to features shipped with agentic tools.
Due Diligence Questions that Surface Red Flags
- How is token spend traced back to specific workflows and outcomes?
- Which cohorts show durable cycle time gains after 90 days?
- What sensitivity has management run on significant token price swings?
- Are gross margins modeled by customer segment or averaged across the book?
- Is the pricing model hybrid - base subscription plus usage tiers - as Bessemer says most buyers understand?
Vague answers to these questions signal a poorly instrumented or unmanaged rollout. Founders who cannot provide detailed financial models are unprepared for market volatility. With token demand projected to grow substantially according to industry reports, failing to perform sensitivity analysis on cost of goods sold (COGS) introduces significant risk.
Checklist for Financial Modeling
| Variable | Low-case | Mid-case | High-case |
|---|---|---|---|
| Input tokens per workflow | Variable based on complexity | Moderate usage | High complexity workflows |
| Output tokens per workflow | Basic outputs | Standard outputs | Complex outputs |
| Unit token price (USD) | $15/M input tokens and $75/M output tokens for Claude Opus | Market rates vary | Premium model pricing |
| License plus tool fees per seat | Industry standard pricing varies | Mid-tier pricing | Enterprise pricing |
| Gross margin | Varies by implementation | Industry average | Lower margins for complex deployments |
The following modeling bands, based on the academic and vendor data cited, can be used to construct a margin waterfall analysis. Prudent investors will also model a renewal stress test, such as a usage drop after the initial "novelty phase," to assess whether outcomes-based pricing can mitigate potential churn.
Quick Scan for Red Flags
- High token burn without cohort level attribution.
- Productivity metrics limited to pull request counts or lines of code.
- No baseline data from the month before pilot launch.
- Fixed COGS assumption despite usage-based API contracts.
This checklist, alongside the metrics and questions above, provides a robust diligence framework for evaluating any agentic coding investment.
What baseline metrics should investors insist on before approving any agentic-coding spend?
Ask the company to provide a telemetry baseline that captures:
- Average cycle time per task
- Defect / change-failure rate
- Cost per delivered feature (labor + token + infra)
- Team-level throughput (not individual PR counts)
Without these numbers, every post-rollout comparison is meaningless. Studies show that runs on similar tasks can differ significantly in token consumption, so a stable baseline is the only way to prove the tool, not random variance, caused any gains.
How do we translate token spend into defensible ROI?
Convert tokens into cost-per-outcome instead of cost-per-token. The most investor-ready formula is:
ROI = (Total value generated - Total deployment cost) / Total deployment cost × 100
- Value generated = reduced engineering hours + faster release revenue + fewer escaped defects
- Total deployment cost = licenses + input/output tokens consumed + infra + compliance overhead
In practice, the review-fix loop can consume a significant portion of all tokens in a multi-agent session (arXiv ChatDev study), so you must model input costs, not just the cheaper output tokens.
Which red flags signal high burn with no measurable return?
Run the 3-question sanity test:
1. No attribution model - the company cannot tie token spikes to cycle-time or defect changes.
2. Tool-only metrics - dashboard is full of PR volume or lines of code instead of cycle time, defect rate, or revenue impact.
3. Flat COGS assumption - the model assumes token prices stay constant even though industry reports project substantial growth in monthly token demand.
What telemetry proofs should be handed over during diligence?
Request these artifacts in a data room:
- A/B or cohort file - same team before vs. after deployment (30-, 60-, 90-day windows).
- Pilot KPI sheet - table of cycle time, defect rate, and cost per task per pilot team.
- Procurement contract appendix - token-price escalators, caps, and any usage-based overages.
- Feature-level P&L - revenue attached to features shipped faster because of the agent.
How should token-price sensitivity be stress-tested in the financial model?
Add four sensitivity levers to the spreadsheet:
1. Token cost per workflow - include input tokens (majority of spend) and retry loops.
2. Usage elasticity - model adoption rate changes when token costs fluctuate.
3. Hybrid pricing - model switching from flat seat fee to base subscription + usage/outcome tier (Bessemer recommends this when you're uncertain).
4. Renewal sensitivity - assume churn jumps if ROI falls below acceptable thresholds in the first renewal cycle.
Remember: token prices, compute rates, and model efficiency can shift independently, so you need scenario tabs for bear (reduced margins), base, and bull (increased volume, reduced token costs).